Buying guide
27-inch 1440p vs 32-inch 4K for coding and office work
A 27-inch 1440p monitor is a practical candidate when you want a moderate physical size and useful desktop space without relying heavily on scaling.
A 32-inch 4K screen offers a larger panel and higher pixel density, but the amount of usable workspace depends on the scaling you choose. Compare the readable result in your applications, not just the resolution printed on the box.
For coding and office work, the important question is whether the screen lets you read, arrange and switch between your actual tools comfortably. A higher pixel count is valuable only when the computer connection and software can use it well.
This guide uses calculated examples rather than personal product-test claims.
The basic numbers
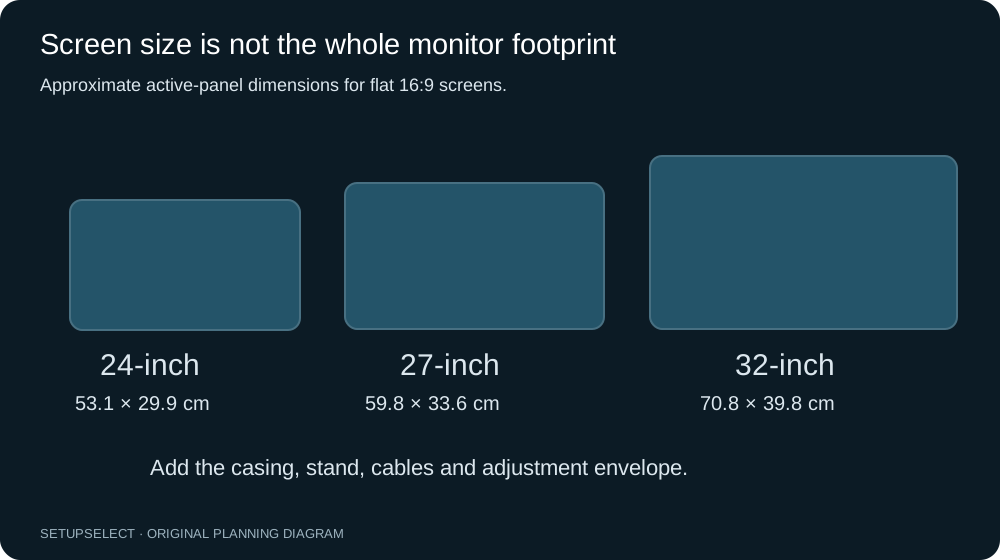
A 27-inch 16:9 panel has an active area approximately 59.8cm wide and 33.6cm high. A 32-inch 16:9 panel is approximately 70.8 × 39.8cm. The larger panel therefore adds about 11cm of active width and 6cm of active height.
Finished housings and stands add further dimensions which must be checked for the exact models.
At 2560 × 1440 pixels, the 27-inch panel has approximately 109 pixels per inch. At 3840 × 2160, the 32-inch panel has approximately 138 pixels per inch. Pixel density is calculated from the diagonal pixel count divided by diagonal inches.
It describes geometry, not colour accuracy, contrast, motion quality or the quality of text rendering.
| Combination | Native resolution | Approximate density | Physical active width |
|---|---|---|---|
| 27-inch QHD | 2560 × 1440 | 109 PPI | 59.8cm |
| 32-inch 4K | 3840 × 2160 | 138 PPI | 70.8cm |
The 4K panel has 2.25 times as many pixels in total, not simply twice as many. That does not mean every user gets 2.25 times the useful application space. Scaling enlarges interface elements, and applications handle that process differently.
Understand effective workspace
A useful first approximation is to divide horizontal and vertical pixel counts by the scaling factor. At 150% scaling, a 3840 × 2160 desktop corresponds to approximately 2560 × 1440 logical units.
That is the same nominal logical workspace as QHD at 100%, although text rendering and application behaviour are not identical.
At 125% scaling, 4K corresponds to approximately 3072 × 1728 logical units. At 200%, it corresponds to 1920 × 1080. These calculations help frame the decision, but they are not a guarantee of what a particular operating system or application will render.
Browser zoom, application-specific settings and display modes can modify the effective result.
| Display setting | Approximate logical workspace | Interpretation |
|---|---|---|
| QHD at 100% | 2560 × 1440 | Baseline comparison |
| 4K at 125% | 3072 × 1728 | More nominal workspace with smaller elements than at 150% |
| 4K at 150% | 2560 × 1440 | Similar logical workspace to the baseline |
| 4K at 200% | 1920 × 1080 | Larger interface elements and less logical workspace |
Because the 32-inch screen is physically larger, the same logical layout can occupy more physical space. That may be helpful even when the number of visible columns or windows is similar.
The advantage can be clearer rendering or larger readable content rather than simply more windows.
A coding workflow example
Imagine an editor with a project tree, a code pane and a terminal, plus a browser showing documentation. First decide which elements must stay visible together.
If documentation is consulted occasionally, a fast window-switching workflow may be preferable to permanently dividing the screen into two narrow halves.
At a nominal 2560-pixel logical width, two equal windows have roughly 1280 units each before borders and application chrome. An editor with a wide sidebar can leave a much smaller code area.
Increase font size to what you actually use, open representative source files and check line wrapping. A screenshot using tiny text can exaggerate the apparent benefit of either display.
At 4K with a lower scaling factor, more logical width may allow the editor and documentation to remain useful side by side. However, if you enlarge application text substantially, some of that apparent gain disappears.
The meaningful test is the finished workspace with readable text, not the desktop at its smallest possible interface setting.
A spreadsheet and document workflow
For spreadsheet work, compare a sheet with realistic column widths, headings and formulas. Count the columns visible without shrinking them below a usable size.
Also check the formula bar, ribbon, dialog boxes and secondary panels; these can become the limiting parts of the interface even when the cells look good.
For document review, try two pages side by side and then a document beside a reference browser. A 32-inch panel can make this physically easier to view, but the result depends on page zoom.
If you normally use a large text size, extra physical area may improve reading without increasing the number of pages shown.
Video calls introduce another arrangement: a meeting window, notes and perhaps a shared presentation. Test where the camera sits relative to the content you watch.
A larger display may encourage placing the speaker view in a corner, which can make eye contact awkward even though all the windows technically fit.
Physical text size matters
The same nominal pixel-sized text occupies less physical space on a higher-density panel at unchanged scaling. That is why a 32-inch 4K screen can initially look surprisingly small despite being larger overall.
Raising scaling changes the relationship between logical interface units and physical pixels.
Do not treat 100% scaling as an achievement or 150% as wasted resolution. The purpose is a readable interface. A dense panel can still provide smoother-looking text at a larger scale, depending on rendering, panel structure and the viewing conditions.
Conversely, an application that does not scale well may remain a practical problem on an otherwise excellent monitor.
Use the PPI calculator to compare geometry, then validate it with a real application trial. If possible, view both screens with the same content and similar brightness.
Avoid comparing one with unusually small text and the other with unusually large text, because that mainly compares settings rather than hardware.
Desk and room fit
The 32-inch panel adds height as well as width. Check shelving, window handles and the available adjustment range. A screen that fits between two objects at one height may hit them when raised or tilted.
Include the support and cable access in the measured envelope, not just the active panel dimensions above.
A deep stand can bring the screen forwards on a shallow desk. An arm may help, but only if it supports the exact display and fits the desk structure.
Some arms need rear joint clearance, so a wall-mounted-looking product photograph can conceal a substantial gap behind the actual installation.
Read the 60cm versus 80cm desk guide and monitor-arm compatibility guide before deciding that one screen size requires a particular desk.
Screen diagonal alone does not establish desk depth or viewing distance.
Connection capability can decide the choice
Confirm the resolution and refresh rate supported by the computer, dock, adapter, cable and monitor input together. The weakest part of the chain can limit the output.
Connector shape alone is insufficient: two ports that look the same can have different capabilities, and docks can share available bandwidth across outputs.
Check whether your laptop supports the proposed configuration while its own screen is open, and whether another external monitor changes the available modes. For a managed work computer, confirm restrictions before buying.
A display that requires an unavailable driver or unsupported dock configuration is not a useful upgrade.
Test waking, sleep behaviour and reconnection as part of the trial. A setup that works after a careful initial connection but fails every time the laptop returns from a meeting can be frustrating.
Keep the exact cable and input combination recorded so troubleshooting does not become a sequence of random substitutions.
Refresh rate is separate from office workspace
A higher refresh rate can change the appearance of scrolling and pointer motion, but it does not increase the number of spreadsheet columns or code lines on screen. Treat it as a separate preference and compatibility requirement.
Do not sacrifice readable text or reliable connections merely to maximise a headline refresh figure.
If the monitor also serves gaming, check the desired resolution and refresh together, plus the computer or console's supported modes. A product may support a high refresh rate only through a particular input or at a lower resolution.
The gaming display compatibility checker can organise the questions, but manufacturer documentation remains the deciding evidence.
For office-only use, spending on a suitable stand, reliable connection or better adjustment may solve a more important problem than a specification you rarely use. Compare the complete setup cost and function rather than one number in isolation.
Mixed-monitor arrangements
Adding either display beside an existing laptop or monitor creates another scaling question. Windows may change physical size as they move between displays with different density and scaling settings.
Test whether the applications you use behave sensibly and whether the physical heights can be aligned in a useful way.
A 32-inch primary screen with a smaller secondary display can work well when the second screen has a narrow, defined role.
A pair of 27-inch screens may provide clearer task separation, but occupies more width and needs additional mounting and connection checks. The dual-monitor desk article covers that physical arrangement.
Do not buy a matched pair solely to avoid a cosmetic mismatch. Reusing a functioning screen can be sensible if the software and layout work. Equally, do not retain a troublesome secondary display merely because it is already owned.
Assess the benefit against the ongoing complexity it adds.
A controlled comparison you can perform
Prepare three representative tasks: a code or text-heavy task, a wide spreadsheet or document task, and a meeting or communication task. Use the same files on both candidate arrangements.
Set each display to a readable configuration rather than forcing identical numerical scaling when the physical result differs.
Record which windows must overlap, how often you resize them, whether small controls remain readable, and whether you move closer to the display. Include a normal-length work session where possible.
A brief shop demonstration may reveal obvious problems but will not reproduce every aspect of your working day.
After the trial, distinguish the reasons for preference. “The text is clearer” is different from “I can keep another panel open”, and both differ from “the larger image is easier to read”.
Knowing the reason prevents buying a feature that does not address the actual need.
When each option is the better shortlist
Shortlist 27-inch QHD when the physical footprint suits the room, the applications work well at your chosen scale, and the available logical workspace already covers the task.
It may also avoid replacing a dock or mount that cannot support the proposed larger configuration. Verify the particular product rather than assuming every QHD display behaves alike.
Shortlist 32-inch 4K when you value the larger physical canvas or higher density, have confirmed readable scaling, and can support the complete connection and mounting arrangement.
It is especially worth testing if the current problem is dense documents or a need for more simultaneous workspace, but that should be demonstrated with your own applications.
Neither option is inherently the professional choice. An appropriate screen with sensible settings is more useful than a nominally superior one that consumes the room or makes daily software awkward.
Keep the decision tied to the problem you are trying to solve.
Check the meeting and screen-sharing workflow
A high-resolution desktop can create a second practical problem: what colleagues see when you share it. Test sharing an application window rather than the entire screen, and check whether the receiving display can show the relevant text clearly.
This is a workflow consideration, not a reason to avoid 4K.
Also test moving windows between the laptop and external monitor. Different scaling settings may change apparent window sizes or expose application-specific behaviour.
Include your remote-desktop client, presentation software and any older work application in the trial rather than testing only a browser.
Write down the settings that make your actual tasks comfortable. The best specification on paper is less useful than a configuration that preserves readable text, reliable connections and a predictable working routine.
Method, sources and next step
All dimensions, pixel densities and logical-workspace figures are original calculations for the stated sizes, aspect ratio and scaling factors. They are rounded examples, not measured product results. Application behaviour must be checked directly.
The HSE workstation checklist provides a broader assessment framework, while product manuals establish actual inputs, supported modes and physical dimensions.
Start with the PPI calculator, then record a readable scaling setting and a representative task layout.
Finally, check the 24, 27 and 32-inch physical-size comparison and the real desk arrangement before ordering.
Continue researching